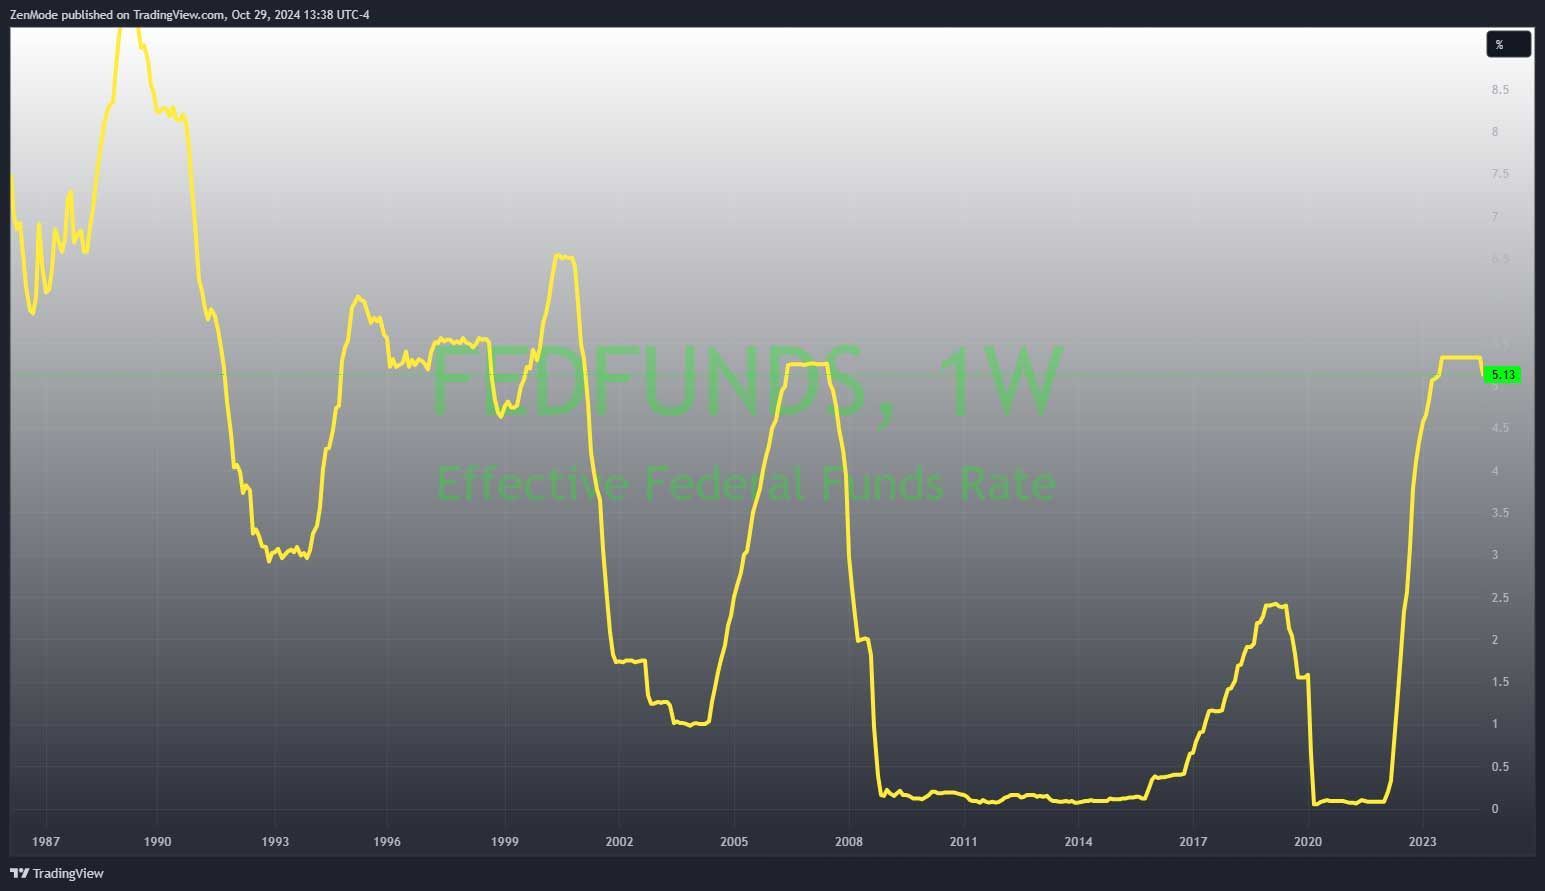
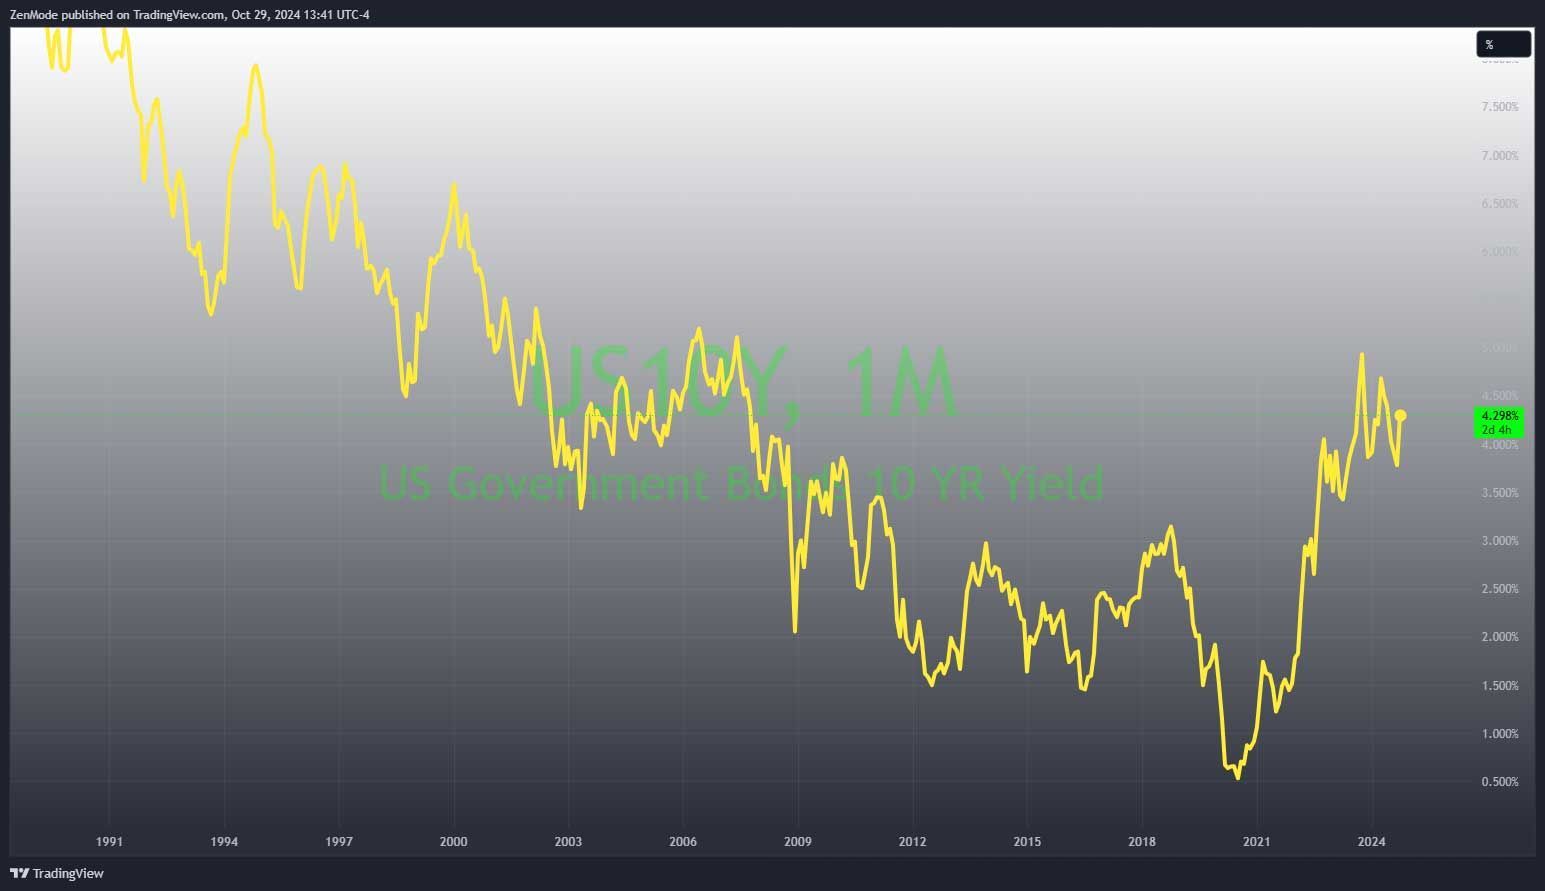
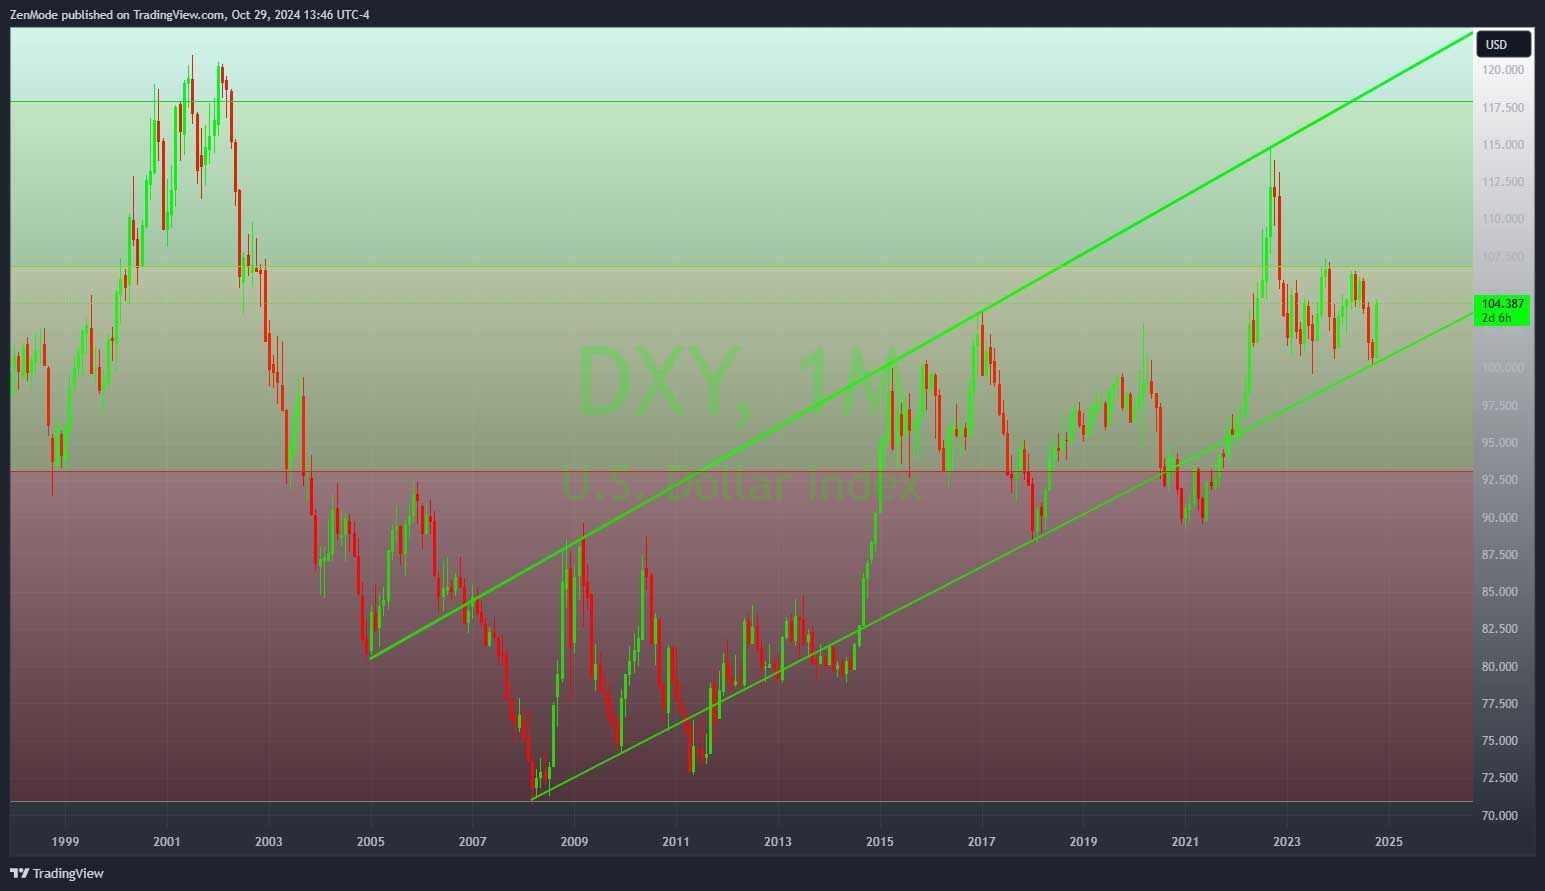
As the Federal Reserve lowers short-term interest rates, we can expect a positive ripple effect on consumer spending. Lower rates generally encourage borrowing and spending, which supports overall economic growth. This trend further reinforces the connection between consumer income and the demand for trucking services. The current FedFunds rate sits at 5.13%.
Summary of 2024 US Transportation Economic Update by the NMFTA
Important Economic Research & Trends within the Transportation Sector
The National Motor Freight Traffic Association (NMFTA) has released its 2024 US Economic Update, presented by Donald Broughton of Broughton Capital. This update is packed with valuable insights into the economic landscape and its impact on freight and logistics.
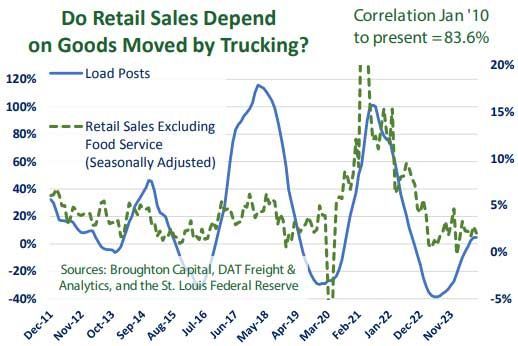
Consumer spending patterns are shifting, oscillating between goods, services, experiences, and technology. This fluctuation influences shipping volumes. As consumer incomes grow, the demand for goods will likely rise. The report highlights a strong correlation—over 80%—between consumer income and the volume of dry van loads.
This link is neither random nor coincidental.
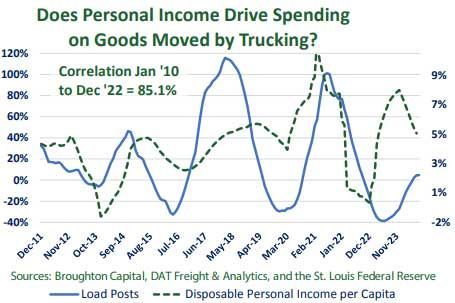
If consumer incomes continue to expand at a pace similar to the last three years, the forecasts for shipping volumes remain positive. Despite ongoing fears of a recession, grounded in emotional responses and sensationalism, the data tells a different story. Hard data—like verifiable income and freight flows—provides a clearer picture for understanding economic conditions.
The trucking industry serves as a reliable early indicator of economic trends. While analysts on Wall Street may take time to recognize these shifts, trucking professionals are often the first to observe changes in the consumer and industrial economies. They notice variations in load volumes and rates, providing insights into market health. Moreover, truck drivers offer firsthand knowledge of specific shippers, noting those who adhere to schedules and those who do not.
Who prepared and analyzed this data?
Donald Broughton founded Broughton Capital in 2017 after a successful career as a top analyst on Wall Street. He has a proven track record, having warned about an impending economic slowdown as early as mid-2006. His expertise positions him as a credible source in understanding the intricacies of the freight industry and broader economic conditions.
This useful update from NMFTA serves as an essential resource for decision makers navigating strategic planning within the logistics and transportation sectors. By leveraging data and insights from the trucking industry, businesses can make informed decisions that align with economic trends.
Economy and Consumer Income Continue to Grow Robustly
The economy is showing signs of resilience, with consumer income continuing to grow. This growth directly influences spending patterns, shifting from goods to services and experiences, and back again. Historically, as disposable personal income (DPI) increases, retail sales and consumer spending rise accordingly. This relationship is crucial for predicting trucking demand. When consumers earn more, they spend more on goods, leading to increased demand for trucking services.
Federal Reserve is Lowering Short-Term Rates
10 Year Treasury Yield is Falling (Mortgage Rates Will Follow)
Import Container Volumes are Approaching All-Time Highs
Import container volumes are experiencing a robust rebound. In July, these volumes topped 2.27 million TEUs and reached 2.3 million TEUs in August. Such high levels of import containers indicate that retailers are preparing for a significant increase in consumer spending on goods this fall. This surge in import activity signals a direct correlation to heightened demand for trucking services as goods are transported from ports to distribution centers.
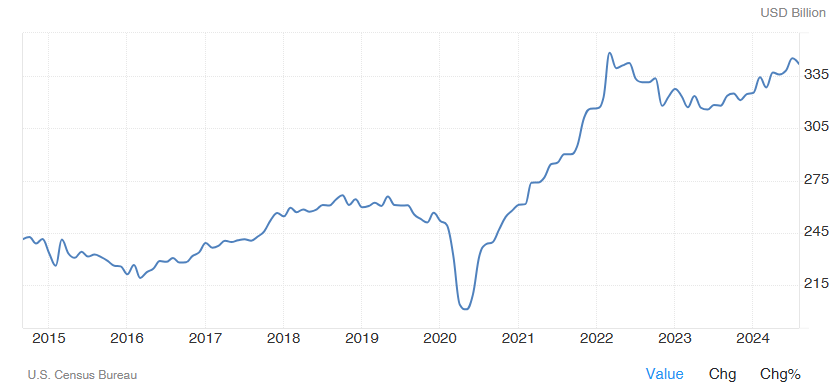
The Industrial Economy is Resurging and Exports are Growing Despite a Strong U.S. Dollar
So, Why Isn’t Trucking Demand Stronger?
Despite these positive economic indicators, trucking demand has not kept pace. As we've observed in this column since the beginning of the year, the relationship between income and spending remains direct: when we earn more, we spend more; when we earn less, we cut back. This predictable pattern means that predicting trucking demand should generally be straightforward. However, factors complicate this equation.
Disposable Personal Income (DPI), especially on a per capita basis, has been a reliable predictor of trucking demand. Typically, when DPI rises, so does consumer spending. This, in turn, increases the need for trucking services. Yet, while DPI has been a strong indicator for short-term predictions, its reliability diminishes beyond a three-month horizon.
A Shift in Consumer Behavior
However, a significant divergence between consumer income and spending on goods began in May 2022. By late December 2023, this gap reached record levels and has continued to persist. This breakdown in correlation can be attributed to three key factors:
- Interest Rate Increases: Interest rates surged from historic lows, slowing housing starts. Buyers adjusted their expectations regarding affordable homes, leading to a decline in goods purchased for furnishing new residences.
- Shift Toward Experiences and Services: Consumers increasingly spent on experiences and services, which do not require trucking for transport, while reducing expenditures on goods.
- Retail Inventory Adjustments: Retailers initially over-ordered to address stock shortages. However, as inventory-to-sales ratios normalized, many retailers overcorrected and under-ordered, resulting in inventory imbalances.
The Relationship Between TL and LTL Demand
As overall volumes decline at the onset of a cyclical contraction, shippers place fewer orders, which are often smaller in size. LTL carriers may see a decrease in the number of pallets per shipment; however, these declines may be offset by volume from smaller shipments previously considered FTL-sized.
As large LTL shipments diminish and the number of such shipments declines, traffic managers are less likely to consolidate these shipments into multi-stop TL deliveries. Conversely, at the start of a cyclical upturn, large LTL shipments can quickly transition into TL shipments, affecting the LTL mix.
Using dry van load posts in the spot market as an indicator of expected LTL demand has several advantages. While FTLs are not the same as pallets needing LTL services, their volume and rate of change can predict LTL demand directionally and quantitatively.
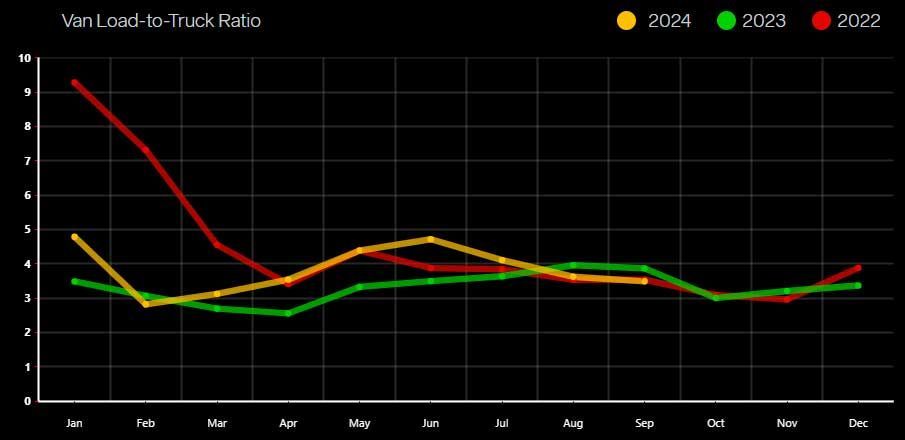
Advantages of Analyzing Spot Market Activity
These analytical advantages include:
- The higher volatility of spot market activity can highlight directional shifts in trends at critical turning points.
- Current spot market data is easily accessible and updated weekly, providing real-time insights.
- The broad usage of the TL Dry Van Spot Market by professional truck drivers and shippers of all sizes results in a more accurate reflection of overall economic conditions.
As overall volumes decrease during a cyclical contraction, shippers tend to place fewer and smaller orders. This may lead to a decline in pallets per shipment for LTL carriers; however, this drop can be balanced by an increase in smaller shipments that were previously classified as FTL-sized. As large LTL shipments decrease, traffic managers are less likely to combine these into multi-stop TL deliveries. In contrast, at the beginning of a cyclical upturn, large LTL shipments can rapidly shift to TL shipments, significantly impacting the LTL mix.
NMFTA's Optimistic Closing Thesis
The NMFTA concluded its report by noting that while the broader economy has experienced some volatility, it has not been as severe as that faced by drivers. Despite numerous pessimistic predictions from the media and politicians, the U.S. economy and per capita consumer income have been growing faster than in other countries, setting many positive records. The NMFTA maintains our long-standing prediction from the mid-2020s that "the coming decades will be the greatest expansion in human prosperity since we emerged from the Dark Ages into the Renaissance. But this time, the progress that took a century through the medieval period will be achieved in a decade. "
TLI Insights
Get the latest logistics insights and tips from Translogistics’ award-winning team. Stay ahead in transportation planning.
Questions? Email us at marketing@tli.email

