What caused ocean freight container shipping rates to rise?
Ocean Shipping Rates
The Pentagon confirms that US and UK strikes in Yemen are reducing Houthi capabilities to carry out attacks on Red Sea traffic. Despite these efforts and renewed diplomatic pressure, attacks persist, leading to widespread diversion of container traffic away from the Suez Canal. Ocean carriers are adapting operations by omitting certain port calls in the Red Sea, Middle East, and some Mediterranean ports, resulting in inventory shortages for European importers due to shipment delays. Although Asian export hubs still encounter space and equipment constraints, congestion remains minimal, with indications of potential improvements in availability.
Delays in ocean freight have prompted some shippers to seek alternatives such as rail or land-bridge options. Although there were anticipations of a notable shift to air and sea-air logistics, the transition has been moderate, with sea-air logistics experiencing a more pronounced shift compared to air cargo. Similar to ocean freight, demand for alternatives is expected to ease.

China Freight Traffic Waterways
Freight traffic on China's waterways increased to 818.80 million tons in April 2024, up from 801.70 million tons in March 2024. From 1983 to 2024, the average freight traffic on these waterways was 244.15 million tons, with a record high of 1,399.10 million tons in February 2024.
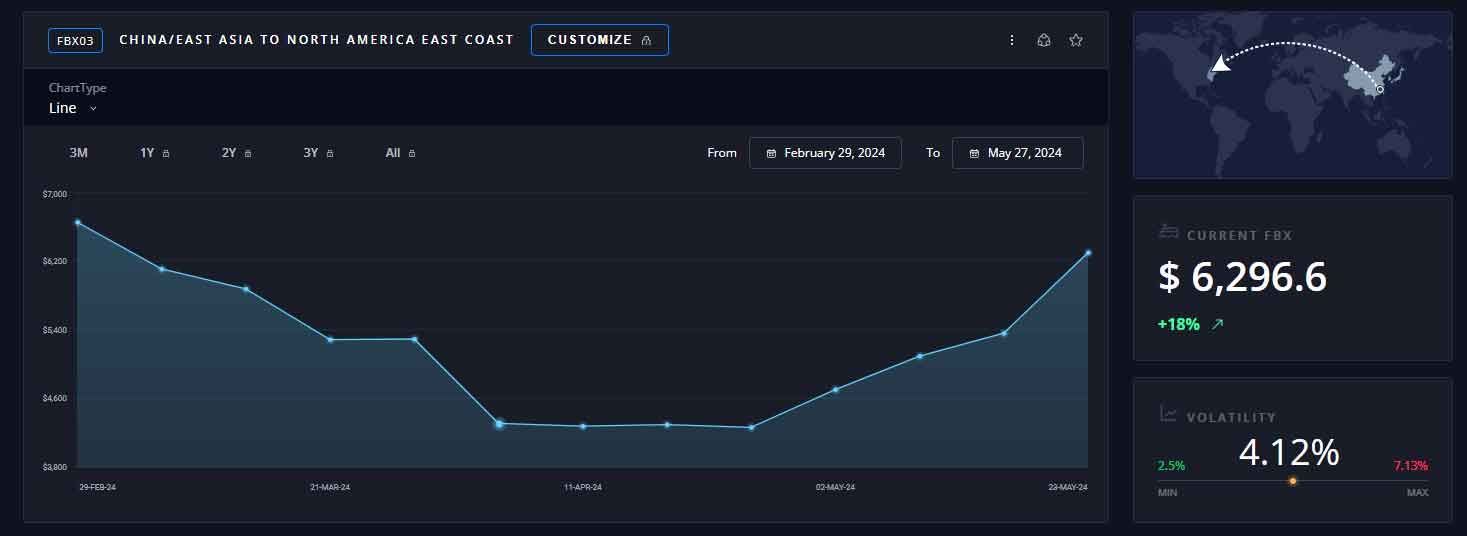
Ocean Freight Container Spot Rates
Ocean freight container spot rates have risen sharply on the world’s top trade routes since the start of May, indicating that the peak season may have arrived early in 2024.
Ocean rates for shipping to the US East Coast (USEC) from Asia have increased by 100% compared to the same time last year in early May, but have declined over the past 60 days.
During April, imports into East Coast ports accounted for 45% of the total, while imports into West Coast ports also accounted for 45% of the total. The share of imports into the US West Coast has rebounded over the past 12 months as west coast port workers ratified their new ILWU contract (through 2028) and Panama Canal draft restrictions constrained East Coast traffic, along with customer concerns regarding the East Coast port labor contract (ILA). Expert analysis suggests that reduced sailings in the Suez Canal will likely lead to increased imports to the US West Coast.
The reasons behind these dramatic rate movements are less clear.
The most significant increases include the Far East to North Europe route, where rates have risen by 30%, from USD $3,349 on April 1 to USD $4,343 per FEU on May 16. This marks a 198% increase compared to 12 months ago when the rate was USD 1,456.

Rates from the Far East to the US West Coast have increased by 29%, rising from USD $3,456 at the start of April to USD $4,468 per FEU on May 16. This is a 214% increase compared to 12 months ago, when the rate was USD 1,422.
On the Far East to Mediterranean route, rates have increased by 22%, from USD $4,144 on April 1 to USD $5,044 per FEU on May 16, which is 100% higher than 12 months ago when the rate was USD 2,521.
Finally, rates from the Far East to the US East Coast have risen by 21%, from USD $4,617 on April 1 to USD $5,584 per FEU on May 16, representing a 129% increase compared to 12 months ago when the rate was USD $2,434.
Over the past 30 days, spot market ocean rates from Asia to Europe have increased. Commentary and outlooks on demand remain uncertain as capacity shortages lead to additional spot market and last-minute demand. Capacity disruptions persist due to Red Sea diversions, causing network imbalances and bottlenecks. Despite this, expectations suggest that spot market rates will either remain similar to or fall below current levels over the next 6 months as capacity additions enter the market.
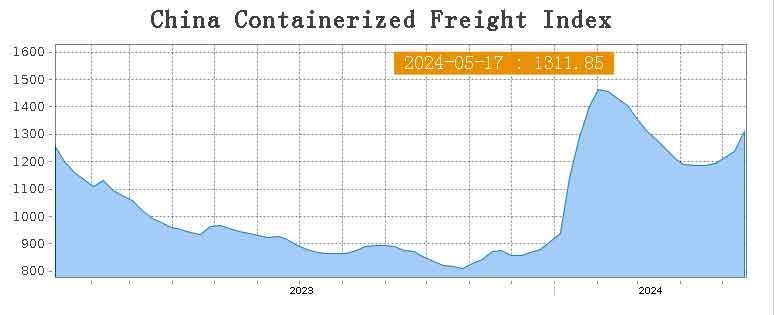
China Containerized Freight Index
| Description | Previous Index | Current Index (5/17/2024) | Weekly Growth % |
|---|---|---|---|
| Composite Index | 1237 | 1311 | 6% |
| Japan | 729 | 744 | 2% |
| Europe | 1736 | 1838 | 6% |
| W/C America | 923 | 1007 | 9% |
| E/C America | 1017 | 1106 | 9% |
| Korea | 458 | 472 | 3% |
| Southeast | 775 | 819 | 6% |
| Mediterranean | 2373 | 2452 | 3% |
| Australia/New Zealand | 834 | 881 | 6% |
| South Africa | 961 | 1074 | 12% |
| South America | 941 | 1091 | 16% |
| West East Africa | 699 | 797 | 14% |
| Persian Gulf/Red Sea | 1697 | 1700 | 0.2% |
Incoterm Support
Many shippers require assistance in choosing the appropriate incoterm. By clicking the link provided, you can download our comprehensive incoterm cheat sheet, which offers clarity on available incoterms and the modes of transportation they are suitable for.
TLI Insights
Get the latest logistics insights and tips from Translogistics’ award-winning team. Stay ahead in transportation planning.
Questions? Email us at marketing@tli.email
Social Media:
Check out more Blog Posts from TLI: