Understanding the United States Manufacturing Economic Recovery
Economic Recovery: V-Shaped vs. K-Shaped Recessions
Economic recessions, though challenging, often exhibit distinct recovery patterns that can impact various sectors differently. Two prominent recovery models are the V-shaped recovery and the K-shaped recession. Understanding these concepts can illuminate how different industries respond to economic shifts, especially in a service-driven economy like that of the United States.
V-Shaped Recovery: A Quick Rebound
A V-shaped recovery is characterized by a sharp decline in economic activity followed by an equally swift recovery. This pattern suggests that once the underlying issues causing the recession are resolved—such as financial instability or external shocks—the economy can bounce back to its previous trajectory. Typically, this recovery is driven by strong consumer demand, increased spending, and confidence in the market.
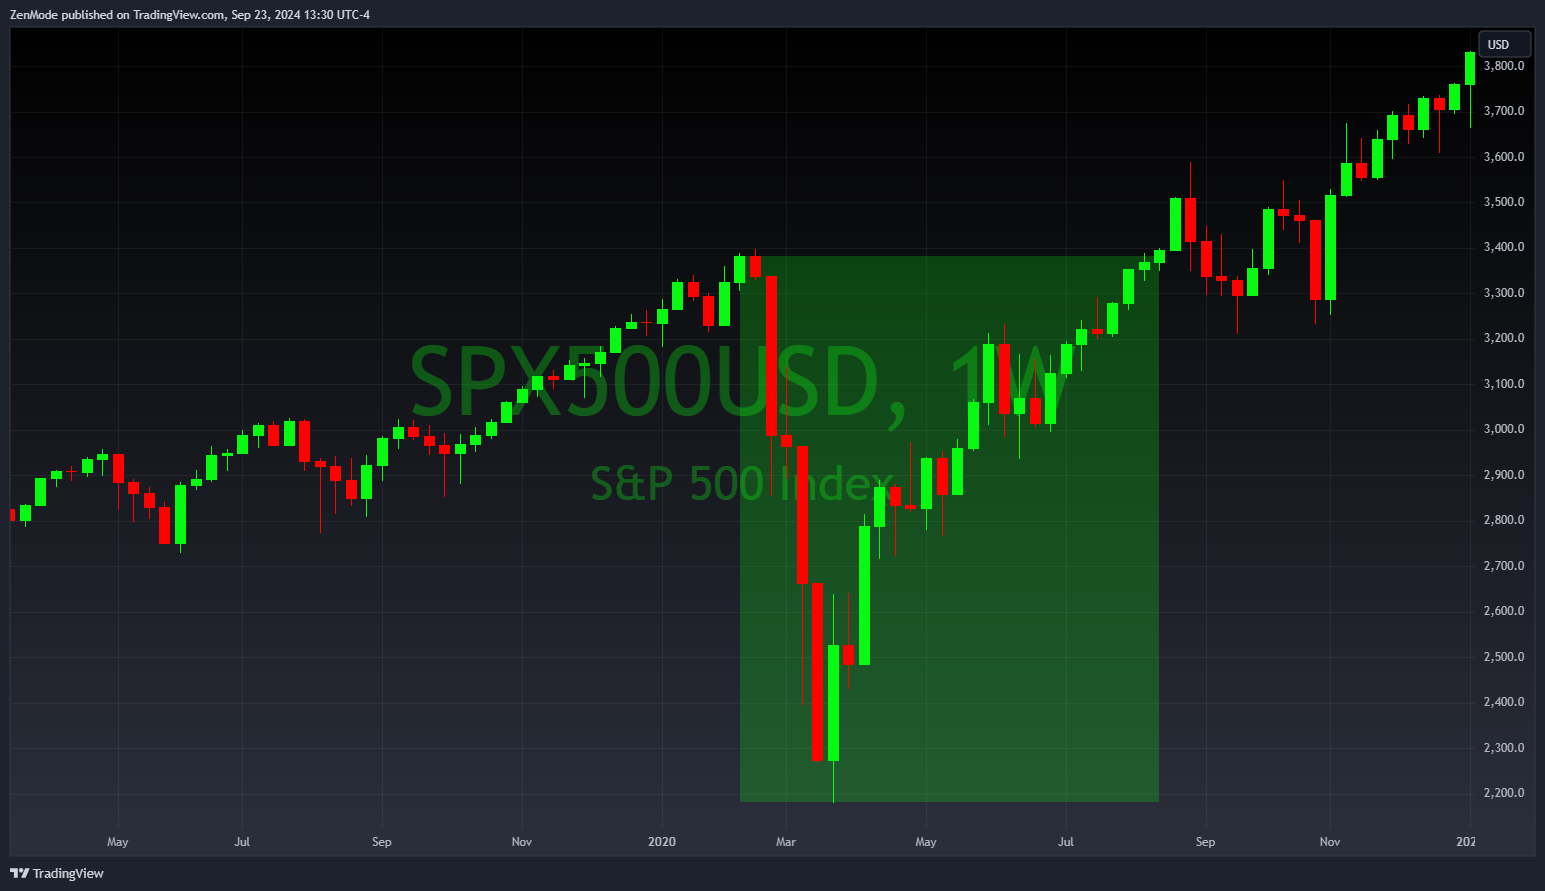
In a V-shaped recovery, sectors that are particularly sensitive to consumer spending—like retail and services—often rebound quickly. This was evident after the initial COVID-19 lockdowns, where certain sectors rapidly regained momentum as restrictions eased and consumer confidence returned.
K-Shaped Recession: Diverging Paths
In a K-shaped recession, different sectors experience sharply contrasting recovery paths. While industries like technology rebound strongly, others continue to struggle, creating a divided economic landscape. This disparity highlights how economic health varies across sectors, with the federal funds rate playing a key role. For example, a technology company with minimal borrowing needs can largely remain unaffected by rising interest rates. However, industries that rely heavily on debt, such as utilities or transportation, face significant pressure from higher borrowing costs.
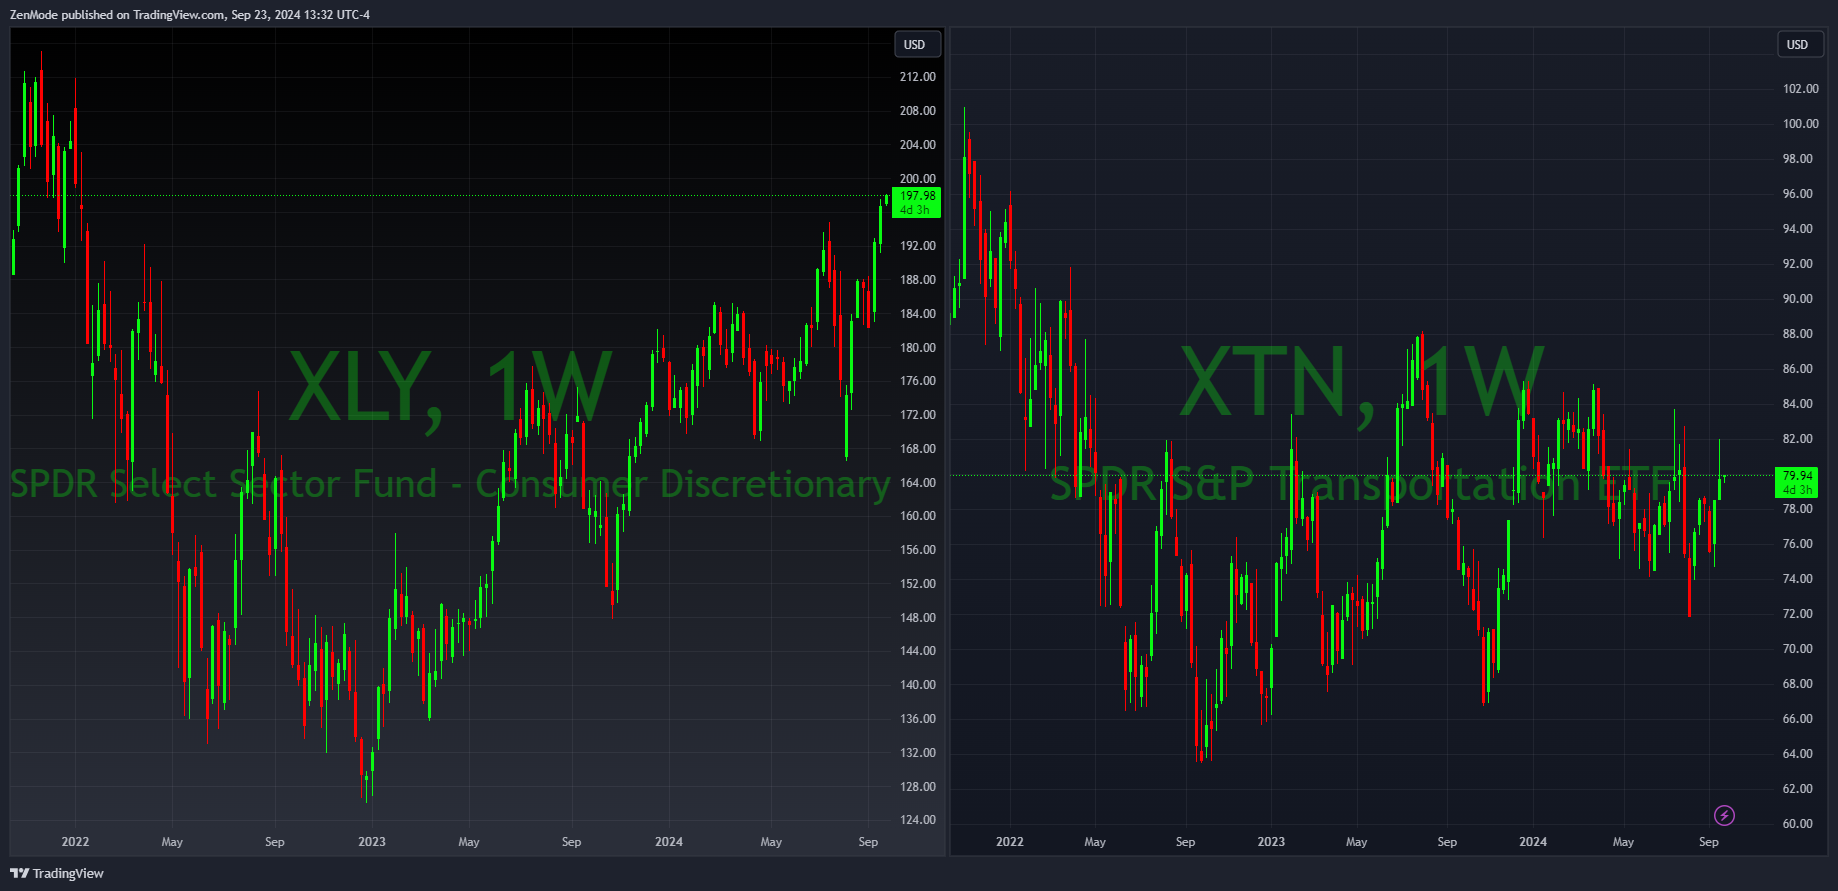
During a K-shaped recession, technology and digital services often thrive, fueled by increased demand for remote work and digital solutions. Meanwhile, traditional manufacturing sectors may falter, grappling with supply chain disruptions and weakened consumer demand.

The Service-Driven Economy and Sectoral Disparities
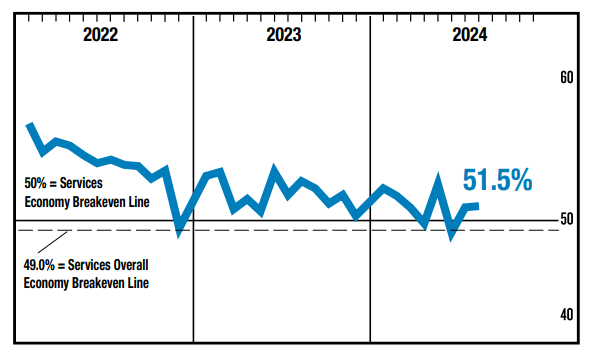
The United States' economy has increasingly become service-oriented, with sectors like technology and finance exhibiting resilience during economic downturns. Unlike manufacturing, which often relies on heavy investments and debt, these service sectors can adapt quickly to changing consumer behaviors and market conditions. Likewise, within the ISM data we can see clearly that services have outperformed manufacturing, and aside from two months, services have largely been within growth mode, however the rate of growth is contracting.
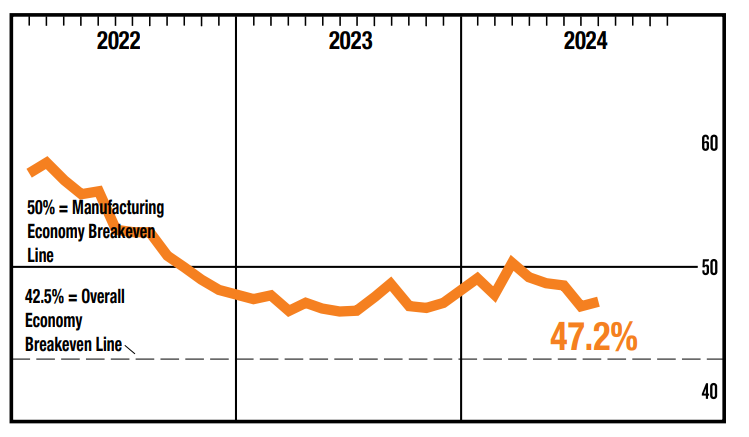
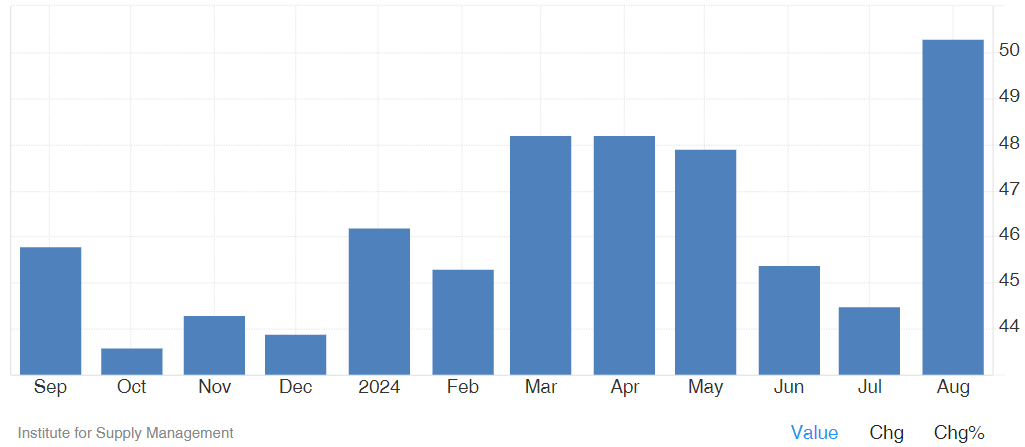
As highlighted in recent economic reports, the manufacturing sector has faced significant challenges compared to the growth seen within the service side. According to the latest Manufacturing ISM Report, economic activity in this sector contracted for the fifth consecutive month as of August, with the Manufacturing PMI® registering 47.2 percent—indicating ongoing contraction. The report reveals that while only one of the five subindexes was in expansion territory, concerns about rising prices and contracting new orders underscore the difficulties facing manufacturers.
The ISM (Institute for Supply Management) Report is a key tool for measuring economic activity in U.S. manufacturing and services. It surveys executives across different industries, gathering data on important factors like new orders, production, supplier deliveries, and employment. This information is used to calculate the PMI® (Purchasing Managers' Index), which serves as a broad indicator of economic health. A PMI® score of 50 represents the balance point—meaning no change in activity. Scores above 50 show expansion and growth, while scores below 50 signal contraction and a slowdown in economic activity.
When the PMI® is over 50, it means the sector is growing, with companies increasing orders, hiring more workers, and producing more goods. A score below 50, on the other hand, indicates contraction, with fewer orders, less production, and possibly job cuts. For example, a recent PMI® of 47.2% for U.S. manufacturing shows the sector is contracting, though the rate of contraction can vary. The ISM report provides valuable insights, helping businesses and policymakers understand economic trends and make better decisions.
| Index | Aug Index | July Index | Direction | Trend (Months) |
|---|---|---|---|---|
| Manufacturing PMI | 47.2 | 46.8 | Contraction | 5 |
| New Orders | 44.6 | 47.4 | Contraction | 5 |
| Production | 44.8 | 45.9 | Contraction | 3 |
| Employment | 46.0 | 43.4 | Contraction | 3 |
| Supplier Deliveries | 50.5 | 52.6 | Slowing | 2 |
| Inventories | 50.3 | 44.5 | Growing | 1 |
| Customers' Inventories | 48.4 | 45.8 | Too Low | 9 |
| Prices | 54.0 | 52.9 | Increasing | 8 |
| Backlog of Orders | 43.6 | 41.7 | Contraction | 23 |
| New Export Orders | 48.6 | 49.0 | Contraction | 3 |
| Imports | 49.6 | 48.6 | Contraction | 3 |
A potential silver lining in the current manufacturing economic conditions is that inventories have finally stopped contracting and have shown growth for the first time after months of decline. This marks a significant shift, as businesses have struggled with depleted inventories due to supply chain issues and reduced production capacity. The growth in inventories signals that supply chains may be stabilizing, allowing companies to restock and better meet customer demand.
After consistent contraction (ISM below 50) in inventory levels, this recent uptick offers some hope for recovery, especially for sectors heavily dependent on steady stock levels to maintain operations. While the broader manufacturing sector continues to face challenges like shrinking new orders and rising prices, the stabilization and growth of inventories could be an early sign that certain aspects of the supply chain are starting to improve, which may pave the way for broader economic recovery in the future.
United States Manufacturing Payroll
In August 2024, U.S. manufacturing payrolls took an unexpected hit, dropping by 24,000 jobs. This sharp decline came as a surprise, especially after a modest upward revision of 6,000 jobs added in July. Forecasters had predicted little to no change for August, making the job loss even more concerning.
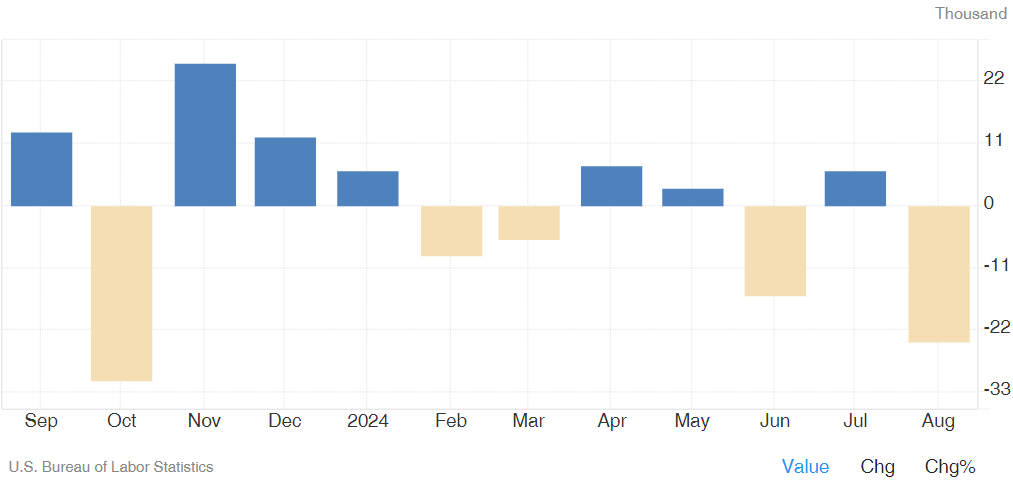
This downturn in manufacturing employment highlights the ongoing struggles within the sector, which has been grappling with a mix of rising costs, supply chain disruptions, and weakened demand. The unexpected drop in payrolls underscores the uncertainty manufacturers face as they navigate economic pressures and a slower-than-expected recovery.
In conclusion, the Federal Reserve's decision to implement rate cuts was necessary to stabilize the manufacturing pain within the economy, though it seems these cuts may have arrived later than many had hoped. The Fed's primary goal was to combat inflation, fully aware that such actions would likely slow growth in key sectors. However, whether these measures have truly brought inflation under control remains uncertain. Concerningly, the Manufacturing ISM reports price growth at 54.0—marking eight consecutive months of rising costs—while the services sector shows an even more worrisome 57.3, with prices climbing for an astonishing 87 months straight. Hospital ISM is also alarming, registering at 58.6%, pointing to significant underlying inflationary pressures.
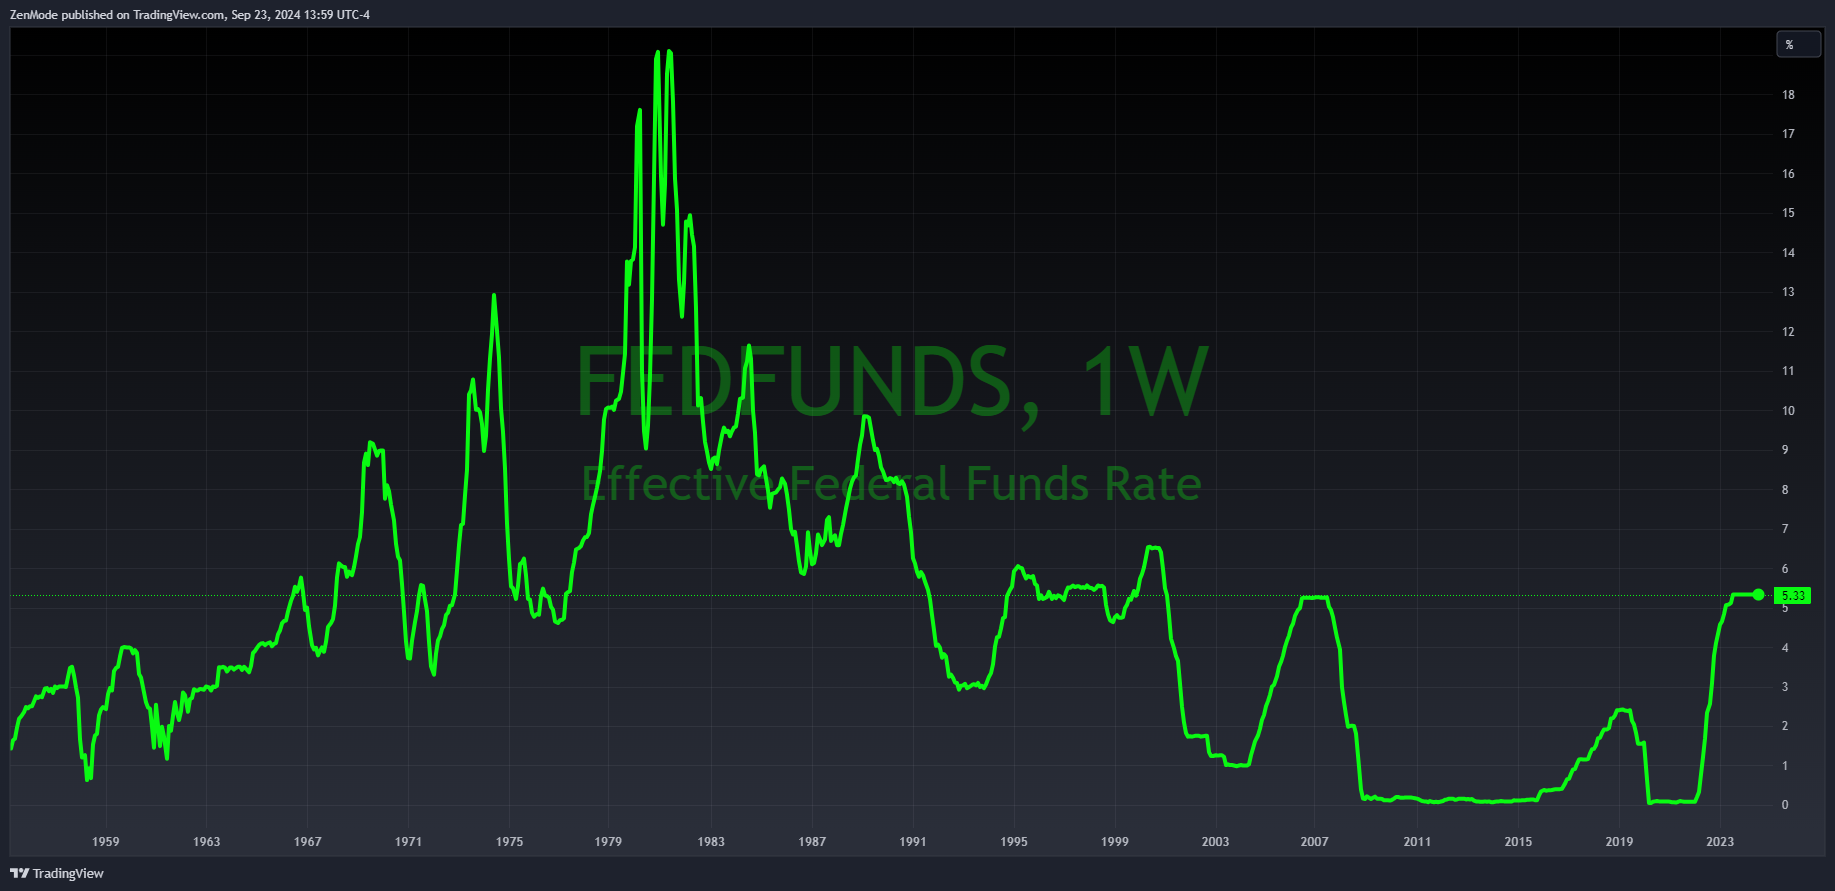
The steady rate hikes over the past two years have clearly impacted the economy, particularly for manufacturing companies. However, the key question remains whether the current rate of price growth is aligning with efforts to control inflation. With significant increases in both services and manufacturing costs, it’s clear that inflation is still a major concern. This has created an especially challenging environment for manufacturers.
Looking ahead, two important risks manufacturers need to be aware of are potential port strikes, which could escalate shipping costs and disrupt access to raw materials, and the upcoming 2025 NMFC code changes that will affect LTL (Less Than Truckload) shipping. Staying informed and prepared for these challenges will be essential for successfully navigating an already difficult economic environment.
TLI Insights
Get the latest logistics insights and tips from Translogistics’ award-winning team. Stay ahead in transportation planning.
Questions? Email us at marketing@tli.email
Social Media:
Check out more Blog Posts from TLI: